plt.subplots
import matplotlib.pyplot as plt

# 2x2 그리드로 여러 축 생성
fig, axes = plt.subplots(2, 2, figsize=(10, 10))

# 각 축에 데이터 플롯
axes[0, 0].plot([1, 2, 3], [4, 5, 6])
axes[0, 1].scatter([1, 2, 3], [4, 5, 6])
axes[1, 0].bar([1, 2, 3], [4, 5, 6])
axes[1, 1].hist([1, 2, 2, 3, 3, 3, 4])

# 각 축에 제목 설정
axes[0, 0].set_title('Line Plot')
axes[0, 1].set_title('Scatter Plot')
axes[1, 0].set_title('Bar Plot')
axes[1, 1].set_title('Histogram')

plt.tight_layout()  # 간격 조정
plt.show()
plt.scatter
import numpy as np
import matplotlib.pyplot as plt

plt.scatter(np.array([[[0, 1, 2], [3, 4, 5]],
                      [[6, 7, 8], [9, 10, 11]]]),
            np.array([[[1, 2, 3], [2, 3, 4]],
                      [[3, 4, 5], [4, 5, 6]]]))
scatter는 형태만 일치하면 알아서 그려줌.

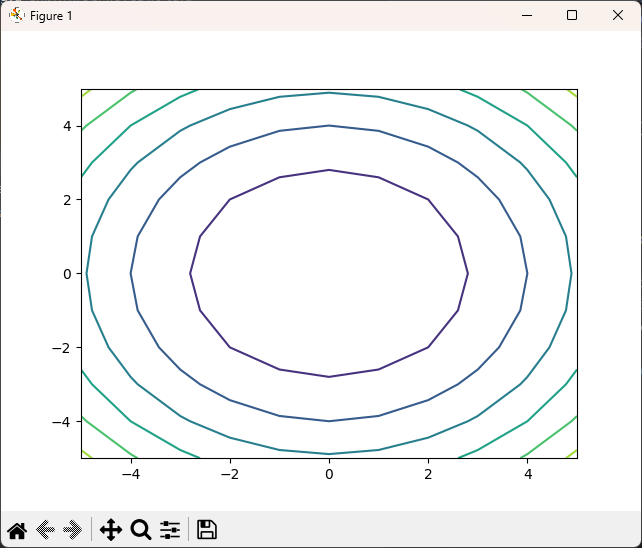
plt.contour
import numpy as np
import matplotlib.pyplot as plt

def f(x):
    return x[:,0]**2 + x[:,1]**2

x = np.linspace(-5, 5, 11)
y = np.linspace(-5, 5, 11)
X, Y = np.meshgrid(x, y)

XY = np.vstack([X.ravel(), Y.ravel()]).T

plt.contour(X, Y, f(XY).reshape((11, 11)))
plt.show()
plt.contour(X, Y, Z, levels, **kwargs)에서, 각 Z[i, j]는 좌표 (X[i, j], Y[i, j])에 해당하는 높이값. Z는 반드시 2D 배열이어야 함.
X, Y가 1차원 배열일 경우, np.meshgrid를 통해 2차원 좌표 그리드로 자동 변환됨.
X. Y가 입력되지 않았을 경우에는 Z의 크기에 맞게 격자점이 자동 배정됨.
즉, Z가 (m, n) 크기의 배열이라면: X = [0, 1, 2, ..., n-1], Y = [0, 1, 2, ..., m-1].
color
08. Matplotlib 색상 지정하기
 **matplotlib.pyplot** 모듈의 **plot()*…
wikidocs.net
'Dev > PYTHON' 카테고리의 다른 글
| [torch] unsqueeze, cat, broadcasting, norm (0) | 2024.12.28 |
|---|---|
| dcor (0) | 2024.12.28 |
| matplotlib animation (0) | 2024.12.27 |
| numpy 기본 (1) | 2024.12.27 |
| 녹스 앱플레이어 다운로드, 파이썬 설치, 클릭 구현 (pywin32) (0) | 2024.08.11 |